Kurt Vonnegut's shapes of stories
The University of Chicago turned down his thesis on them. He kept drawing them anyway.
The short answer
Kurt Vonnegut argued that every story can be drawn as a curve: time runs from left to right, the main character’s fortune runs up and down, and most stories fall into a handful of recognizable shapes, like Man in Hole, Boy Meets Girl and Cinderella.
He first made the case in his master’s thesis in anthropology at the University of Chicago, and the committee turned it down. In his own words, it was rejected “because it was so simple and looked like too much fun.” He kept drawing the shapes anyway, in lectures and in his books, and the university finally gave him the degree in 1971, accepting Cat’s Cradle as his thesis instead. (Open Culture has the whole story.)
How the graph works
Vonnegut’s idea was that stories “have shapes which can be drawn on graph paper,” and that a society’s story shapes are at least as interesting as the shapes of its pots or spearheads. That’s an anthropologist talking, and it explains the method: you don’t judge the story, you plot it.
The horizontal axis is time, from the beginning of the story to the end. The vertical axis is the main character’s fortune, with good fortune at the top and ill fortune at the bottom. Every scene gets a point: is our hero better or worse off than a moment ago? Join the points and you have the story’s shape.
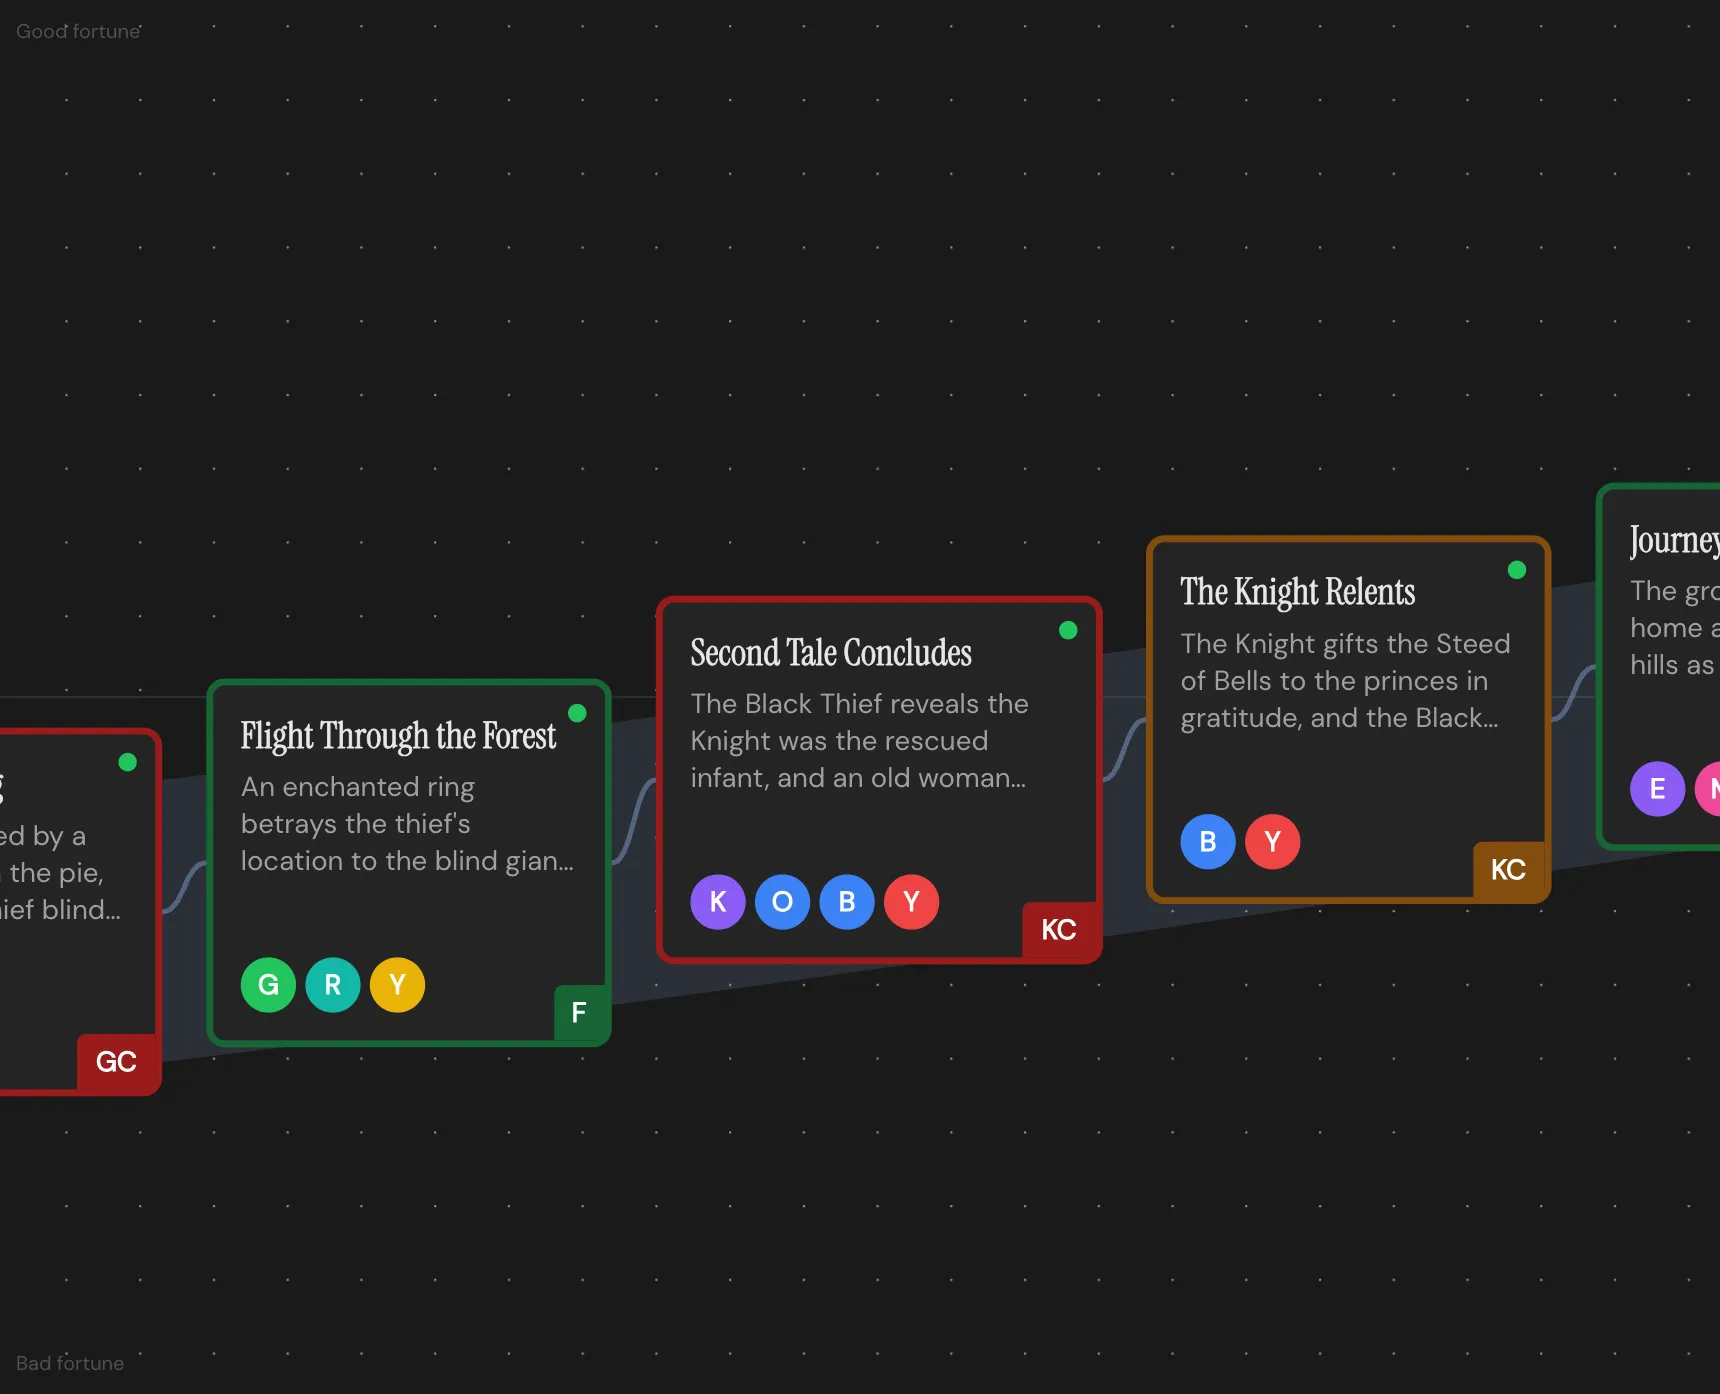
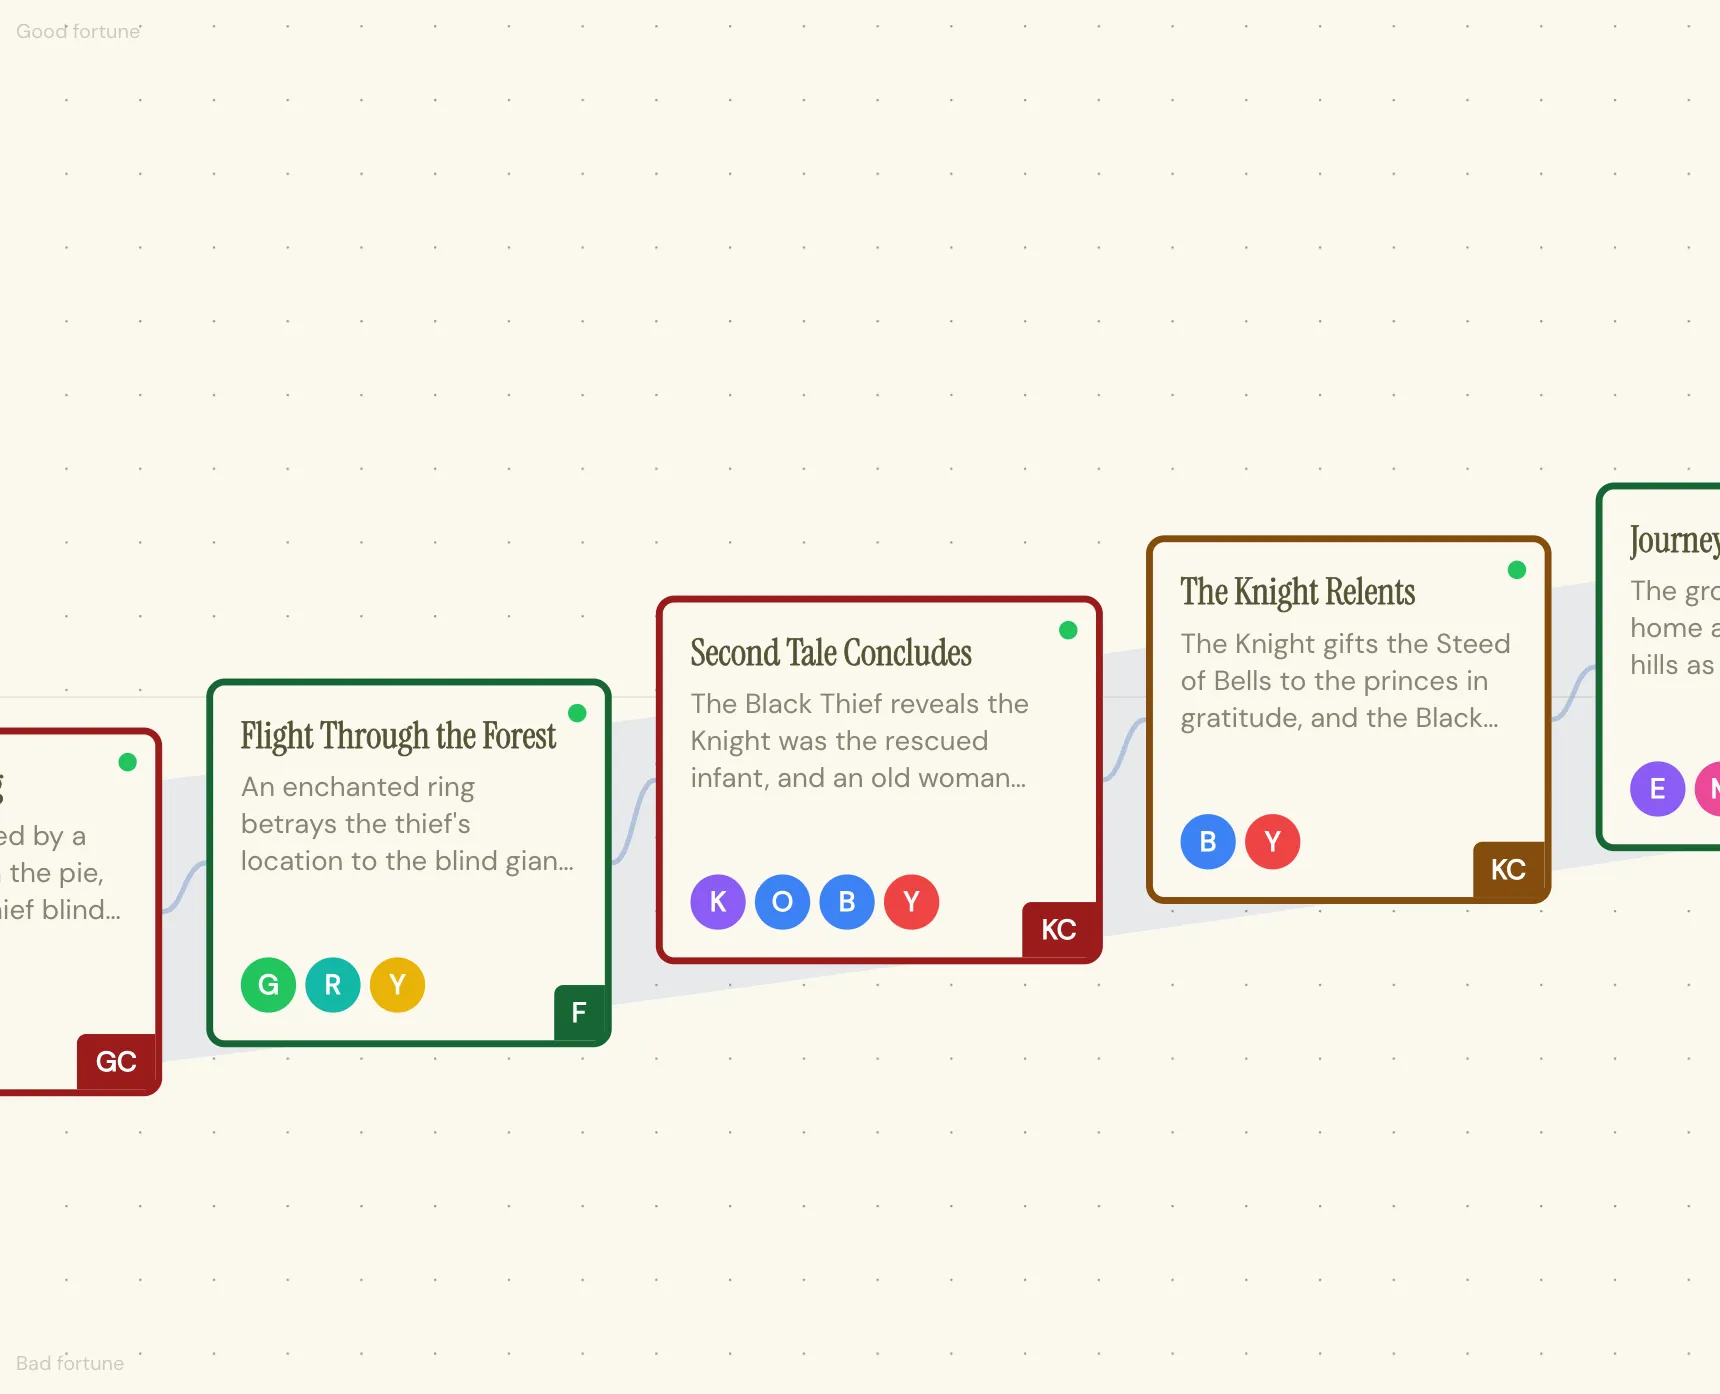
Vonnegut’s graph in practice: good fortune at the top, bad fortune at the bottom, and the scenes in order from left to right. This stretch of a fairy tale is the climb out of the hole, with a classic shape drawn as the band behind the cards. Charted in the Throughline App.
What the curve tracks is how the audience feels about the character’s situation, scene by scene. That’s why it works on anything from a fairy tale to a heist movie, and why two stories with completely different plots can feel strangely alike.
The shapes
Man in Hole. Somebody gets into trouble, gets out of it again, and ends up better off than where they started. The line dips and climbs back higher. It’s one of the most familiar shapes there is, and the study below found it again among its six basic arcs.
Boy Meets Girl. Somebody ordinary comes across something wonderful, loses it, and gets it back for good. It doesn’t need a boy or a girl: the something wonderful can be a job, a dog or a band. The line rises, falls, and rises again.
Cinderella. This one starts at the very bottom. Each gift from the fairy godmother lifts her a step higher, until the clock strikes midnight and she drops, though not as low as where she began. Then the shoe fits, and the line shoots off the top of the graph.
From bad to worse. Vonnegut’s example is Kafka’s The Metamorphosis: Gregor Samsa starts the story in a miserable life and wakes up as an insect, and it only goes downhill from there. The line starts low and keeps falling.
The 2016 study that tested him
Almost seventy years after the thesis, a team at the University of Vermont’s Computational Story Lab tried it with computers. They ran sentiment analysis across 1,327 works of fiction from Project Gutenberg, plotting how positive or negative the language felt from start to finish, and published the result as “The emotional arcs of stories are dominated by six basic shapes”:
- Rags to riches, a steady rise
- Tragedy, or riches to rags, a steady fall
- Man in a hole, a fall and then a rise
- Icarus, a rise and then a fall
- Cinderella, a rise, a fall and a rise again
- Oedipus, a fall, a rise and a fall again
Two of the six, Man in a Hole and Cinderella, carry Vonnegut’s names, which is a nice result for a thesis that was too much fun to pass. The team also found that some shapes get downloaded more often than others, so the shape of a story seems to have something to do with whether people want to read it.
Why the shape matters
Structure tells you where things happen. Shape tells you what those things feel like, and a script can have every beat in the right place and still feel flat, because nothing on the page moves the character’s fortune very far in either direction.
Drawing the curve makes a few problems visible very quickly. A long flat stretch is a sagging middle you can point at. A happy ending that doesn’t land usually turns out to follow a fall that wasn’t deep enough, because Cinderella’s midnight only works if she has something to lose. And a story with several plotlines can run several shapes at once: a Man in Hole A-story with a Boy Meets Girl romance underneath it is a very familiar film.
How to draw the shape of your own story
- Decide what “good” means for this character. Fortune isn’t always money or safety. For one character the top of the graph is being loved and the bottom is being alone; for another it’s being in control versus being exposed.
- List your scenes in order and give each one a point: higher or lower than the scene before?
- Join the dots and compare the result with the shapes above. You’re looking for the closest match, and a story rarely matches perfectly.
- Draw each plotline separately. The romance, the case and the family subplot each get their own line.
- Find the biggest drop and check whether it’s where you want the audience’s stomach to go.
Where the Throughline App comes in
The Shape Workspace is built on exactly this idea. Every plotline gets its own Arc between two Poles you name yourself, so “good” and “bad” mean whatever they mean for this story. You drag each Beat up or down to set its Charge, left and right to place it in time, and stretch it wider to give it more room on the curve. Then you lay one of the classic Story Shapes over the top, Vonnegut’s among them, and see how yours compares. You can toggle several at once, and the overlay is only a reference line, so it never changes your Arc.
So here’s the pitch. The same Beats you chart in Shape are the cards on your board in the Draft Workspace and the scenes you write in the screenplay editor, so the curve, the outline and the script never drift apart. The Constellation maps how your characters feel about each other and lets you scrub through the story Beat by Beat to watch those relationships change. You buy the Throughline App once, it runs offline on your own machine, and it imports the script you already have, which makes your current draft the easiest thing to chart first!
Whatever you use, try drawing the curve of the next film that really gets to you, on a scrap of paper on the way home. After a few of those you’ll recognize the shapes in other people’s work before the second act starts, and that’s the habit Vonnegut was trying to teach.